Four reasons Meta ads stop working. Only one is the ad.
When Meta ads stop working, media buyers blame 'creative fatigue.' Four different problems get bundled under that one word. Only one is actually the ad.
On the first Monday of March 2026, thousands of Meta advertisers opened Ads Manager and found their campaigns had died overnight.
CPMs up 15 to 40%. ROAS down 23%. Conversion rate collapsed. The same creatives that had been printing money the previous Friday now looked broken.[6]
The first word most of them reached for was ‘fatigue.’
Emergency production meetings. New UGC concepts by Wednesday. Kill the old ads.
Meta had shipped a new algorithm called Andromeda that morning. Unannounced.
The creative was fine. The delivery system was different. Thousands of media buyers spent the next month burning production budget on the wrong problem.
This is the pattern. When a Meta media buyer says ‘the creative fatigued,’ four different things could actually be happening. Only one of them is the creative. The default response — ship more creative — fixes one of the four and makes the other three worse.
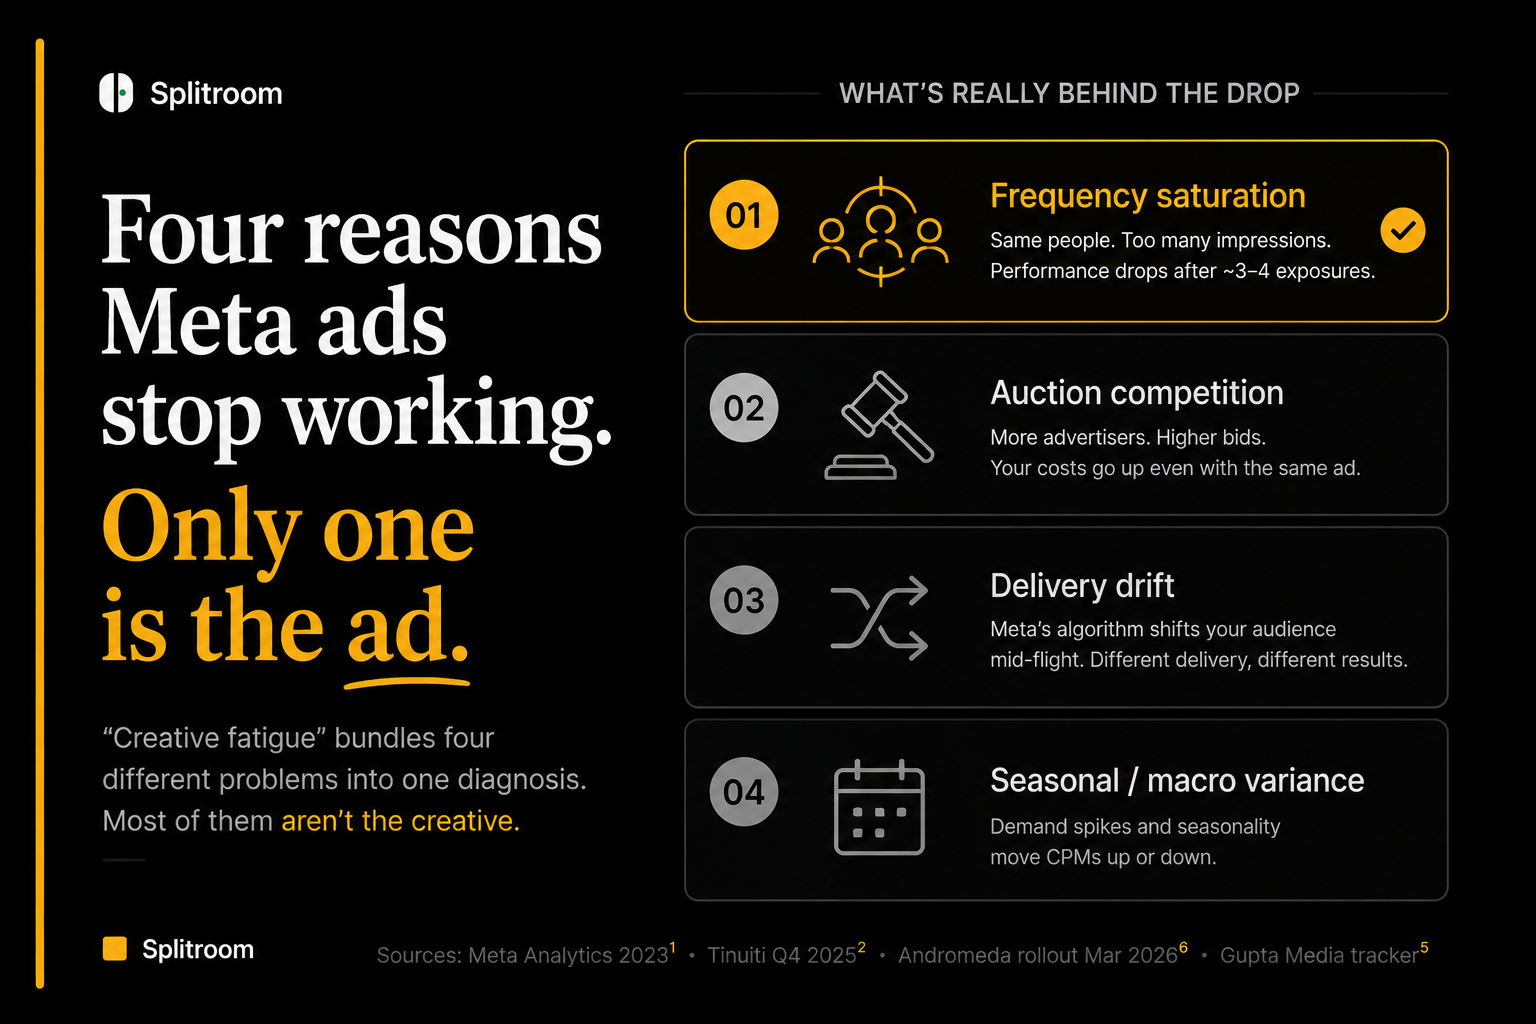
‘Creative fatigue’ bundles at least four distinct causes into one diagnosis. Only one is actually the creative: (1) frequency saturation, when the same user has seen the ad past the 3-4 exposure threshold Meta's own research identifies as the tipping point.[1] The other three would produce identical-looking dashboards: (2) auction competition, where a competitor entered your audience — Tinuiti's Q4 2025 report found Meta's aggregate CPM fell 13% but 44% of individual advertisers saw prices rise;[2] (3) delivery drift, where Meta's algorithm reallocated your audience mid-flight — the March 2026 Andromeda rollout was the mass example;[6] (4) seasonal or macro variance — Gupta Media's tracker shows Cyber Monday CPMs 138% above annual average.[5]The default response to ‘the creative fatigued’ (ship more creative) only fixes cause 1. It makes causes 2, 3, and 4 worse.
Cause 1. Frequency saturation (the one case where it really is fatigue)
Real creative fatigue exists, and it has a specific shape. It is what happens when the same user sees the same ad often enough that incremental impressions produce diminishing then negative returns.
Meta's own Analytics team published the empirical curve in May 2023. Their analysis of roughly 26,000 experimental test cases found that conversion likelihood drops about 45% by the 4th exposure to the same creative, following a decay curve of (N+1)^-0.43. The 4th exposure is where the drop becomes measurable at the account level. Before the 3rd exposure, effects are weak. After the 4th, they compound quickly.[1]
Meta's effective-frequency research pins the operational band at 1 to 2 impressions per user per week as the range that captures 80 to 95% of total brand-lift and purchase-intent gains. The tipping point where incremental exposures start to hurt performance sits around 3.4 exposures. Above that, you are paying for impressions that reduce the ad's effectiveness on the users who see them.
The practical diagnostic: check average frequency in Ads Manager under Delivery breakdown. If your account's average frequency is under 3 in a rolling 7-day window, real fatigue is unlikely to be the cause of a performance drop. Meta's own decay curve does not fire meaningfully below that threshold. If your frequency is 4.5, then yes, you are probably fatiguing. Kill the ad or rotate it.
This is the diagnosis where the standard response works. If cause 1 is what happened, ship a new creative variant. That is exactly what the word ‘fatigue’ should signal.
The problem is that most performance drops are not this.
Cause 2. Auction competition (someone else outbid you)
The load-bearing stat here is Tinuiti's Q4 2025 Digital Ads Benchmark Report, drawn from more than $4 billion in Meta ad spend under their management.
Meta's aggregate Facebook CPM fell 13% year over year in Q4 2025. But 44% of individual Facebook advertisers saw their prices actually rise.Tinuiti Q4 2025 Digital Ads Benchmark Report, via Karooya
Two things are true at once. The industry-level headline number is ‘CPMs fell.’ The individual media buyer's dashboard is ‘my CPMs went up.’ Both are correct.[2]
The reason is that CPM is a distribution, not a single number. Meta's auction reallocates impressions constantly. When one segment's advertisers pull back (say, small DTC brands cutting spend in a soft quarter), the aggregate CPM drops. When a specific competitor enters your audience, your CPM rises even though the aggregate did not.
Meta's Q4 2025 earnings confirm the direction. Average price per ad rose 6% year over year in Q4, and 9% for the full year. Ad revenue was $58.1 billion, up 24% year over year. CFO Susan Li attributed the price rise to ‘increased advertiser demand.’[3] More advertisers competing for the same impressions. That is not fatigue. That is a bid war.
The specific competitors moved the needle. Novadata documented Temu cutting U.S. digital ad spend by more than 50% in March 2025 in response to tariff changes, then ramping back in April. Shein followed the same pattern. Category CPCs on shared intent pools swung materially: Fashion ±50%, Home and Kitchen ±45%, Beauty ±35%, Electronics ±30%, Pet Supplies ±15%. When Temu pulled out, CPCs dropped 25 to 40% in the affected categories. When they came back, CPCs jumped again.[4]
A Meta advertiser in Fashion looking at their Q1 2025 dashboard saw CPMs bouncing 30 to 50% week over week. If they attributed that to their creative, they were wrong. The creative did not change. The auction did.
The diagnostic: pull your CPM trend for the last 30 days, then compare to your industry's aggregate CPM trend for the same window. If yours rose while the industry aggregate rose more, you are riding a broader wave. If yours rose while the industry fell, someone specific started competing with you. In neither case is the fix ‘more creative.’
Cause 3. Delivery drift (Meta reallocated your audience mid-flight)
This is the confound we covered in depth in our companion piece ‘Meta's A/B test measures the algorithm, not your creative.’ The short version: Meta's delivery algorithm does not hold audience allocation constant across time or across ad variants. It reallocates impressions in response to early signal. Sometimes that reallocation is what makes a creative ‘win’ a test. Sometimes it is what makes a running ad appear to ‘fatigue.’
March 2026 was the biggest recent public example. Meta deployed three interconnected delivery updates (collectively known as Andromeda) in the first week of March. The system moved to campaign-level optimization across ad sets simultaneously, versus per-ad-set previously. Advertisers reported CPMs +15 to 40% and average ROAS -23% in the first two weeks. Campaigns below 50 weekly conversion events faced deprioritization.[6]
There was no announcement. Media buyers discovered the change through sudden, unexplained performance drops. Because the drops looked exactly like fatigue on the dashboard (CTR down, CPM up, ROAS collapsed), thousands of accounts responded with emergency production sprints. Two months of new creative got shipped to solve a problem the new creative could not fix.
It is NOT the audiences that got exhausted, but the ad serving machine. The audiences reached by the ads on weeks 2 and 3 are the same people reached by the ads on week 1.Adobe Experience League Community — 'Ad Fatigue in a Digital Analyst's Perspective'
Adobe's analyst framing captures the mechanism.[8] The algorithm reaches new addressable audiences in the first 7 days of a campaign, plateaus in week 2 as it exhausts fresh users within its estimated pool, and by week 3 is recycling the same audiences. The dashboard shows CTR falling. The instinct is to blame the creative. What actually happened is the machine ran out of new eyeballs at the current bid.
Common Thread Collective's analysis of the Cyber Five 2025 shopping period across 3,014 advertisers and 170+ brands surfaced the concentration mechanic on the other side. Only about 2% of ads drove 56% of revenue. In Q1 2026 industry-wide: CPMs up 28% year over year, ROAS down 7%, conversion rate 3.5% → 2.9%.[7] Their editorial framing was blunt.
Andromeda didn't break your targeting. It revealed that you never really had a creative strategy.Common Thread Collective on Andromeda
The point stands beyond Andromeda specifically. Meta ships algorithm updates continuously. Some are announced, most are not. Every time a delivery mechanism changes, a wave of accounts sees performance drops that look like fatigue but are actually the buyer running against an updated version of the auction. The creative is the same as it was. The system judging it is not.
Cause 4. Seasonal and macro variance (external conditions moved)
Some fatigue misdiagnoses are strictly a calendar problem.
Gupta Media has run one of the longest-standing independent Meta CPM trackers, aggregating client account data across their book. Their 2024 data: Cyber Monday CPM was $17.70, which is 138% above the 2024 annualized average of $7.43. Black Friday CPM was $16.85. The single most expensive week of the year (ISO Week 48, Nov 25 to Dec 1) averaged $13.42.[5] If your creative was doing $10 CPMs in November and $24 CPMs on that Monday, nothing about your creative changed. The auction did.
| Period | US Meta CPM | % vs annual average |
|---|---|---|
| 2024 annual average | $7.43 | 100% |
| Black Friday 2024 | $16.85 | +127% |
| Cyber Monday 2024 | $17.70 | +138% |
| ISO Week 48 (Nov 25 – Dec 1) | $13.42 | +81% |
| Q4 2025 US average | $25.49 | Q4 is 22–26% above other quarters |
| Jan 2026 (13-month low) | $15.74 | 38% swing from Nov peak |
Q4 is not the only external mover. The 2024 U.S. election shifted Meta CPMs 5% year over year during the election cycle, with the ramp arriving earlier than usual due to political ad spend concentration in the final 35 days before Election Day. Election-cycle CPM inflation is entirely external and has zero relationship to any specific advertiser's creative.
iOS is the other big external mover, and it is chronic rather than seasonal. AdsAgent's 2026 analysis documents that Meta has been under-reporting real conversions by 20 to 30% since iOS 14.5. Meta CAPI implementations on iOS are also known to over-report ROAS by 30 to 50% due to event_id mismatches double-counting purchases. Meta's Q4 2025 rollout of new incremental attribution methods drove reported conversions up 24% versus prior attribution — without any creative changing.[9]
The result is that measurement itself moves the numbers on your dashboard. A quarterly attribution update, a CAPI configuration change, an iOS version release can all produce apparent performance drops that no creative fix can address.
The four causes in one table
| Cause | Diagnostic signal | What actually fixes it |
|---|---|---|
| 1. Frequency saturation (real fatigue) | Account avg frequency above 3 in rolling 7 days; CTR declines proportional to frequency exposure curve | Ship new creative variant. This is where 'creative fatigue' is the correct diagnosis. |
| 2. Auction competition | Your CPM rose while industry aggregate did not, or a category-specific competitor spike (e.g., Temu re-entering Fashion) | Adjust bid strategy, expand audience, or wait out the spike. New creative does not lower CPMs. |
| 3. Delivery drift (algorithm change or mid-flight reallocation) | Sudden industry-wide drop coincident with a Meta rollout (Andromeda March 2026), or CTR/ROAS decay pattern with flat frequency | Restructure campaign to fit new mechanics. New creative may or may not help; test both. |
| 4. Seasonal / macro variance | Q4 timing, election cycle, iOS update, CAPI reconfiguration, macroeconomic shift | Adjust budget expectations to seasonal reality. Cannot fix with creative. |
Why the misdiagnosis is expensive
The default response to ‘the creative fatigued’ is to kill the running ads and ship new ones. That response is right for cause 1, wrong for causes 2, 3, and 4. When it is wrong, it is expensive in three specific ways.
Production spend on the wrong problem. AI generation costs are near zero per asset (see our companion piece on the AI-shifted creative bottleneck), but human production still runs $2,000 to $5,000 per finished UGC video. A month of unnecessary UGC sprints is $20,000 to $50,000 in production budget spent on a problem the new creatives cannot fix.
Killing your best-performing ads. Common Thread's Cyber Five 2025 data found 2% of ads drove 56% of revenue.[7] AdManage cites Meta's own guidance that the top 10% of ads generate 50 to 70% of conversions.[10] Given that distribution, a premature kill decision is asymmetric. You are much more likely killing one of the 2% than one of the 98%.
Team velocity on the wrong workstream. Emergency production sprints crowd out roadmap work. If your creative team spends March 2026 on Andromeda-response UGC that was never going to fix an Andromeda problem, they are not shipping the Q2 launch or the new-audience test. The opportunity cost compounds beyond the direct production dollars.
AdManage's framework recommends never making a kill decision based on data less than 48-72 hours old. Attribution lag alone is 24-72 hours per iOS/CAPI research. A ‘zero conversions today’ ad might actually have three conversions that just have not been attributed yet. Combined with the 20-30% Meta undercount since iOS 14.5, ROAS-based pause rules that use Meta-only numbers routinely kill profitable ads.[10]
A diagnostic checklist before you call it fatigue
Run through these before you sign off on an emergency production sprint.
1. What is your average frequency? Ads Manager → Delivery breakdown → Frequency, last 7 days. Under 3, real fatigue is unlikely. Over 4, real fatigue is probable.
2. Did your CPM rise or fall? If it rose, check your industry aggregate (Tinuiti, Gupta, or your own historical baseline). Your CPM up while industry down means a specific competitor entered your audience. Your CPM up with the industry means broader inflation. Neither is fixed by more creative.
3. Did Meta ship an update? Check advertising press (PPC Land, Marketing Brew, Digital Applied) for the last 14 days. Meta ships algorithm changes constantly. Andromeda-scale rollouts happen at least once a year. If the drop coincides with a documented rollout, delivery drift is the likely cause.
4. What week of the year is it? If it is Week 47 to 52, or election-cycle October or November, or the first month after an iOS release, seasonal / macro variance is the strong candidate. Cyber Monday CPM is 138% of annual average by default.
5. Only then, ask about the creative. After ruling out causes 2, 3, and 4, if frequency is elevated and no external factor explains the drop, the creative is the residual explanation. Kill it, ship a variant, and move on. But do the ruling-out first.
What Splitroom does about this (and what it does not)
Splitroom does not prevent creative fatigue. It cannot. Frequency saturation, competitor bid pressure, algorithm updates, and Q4 CPM spikes are all conditions Splitroom's pre-launch judgment tool cannot control.
What Splitroom does is change how you diagnose a performance drop after the ad is running.
If a specific static concept was pre-vetted as high-signal by a 1,000-panelist synthetic simulation before it ever entered Meta's auction, and two weeks later it is showing CTR decay, you can rule out ‘the creative was bad from the start’ as the cause. That rules out one of the failure modes and forces you to look at the other three: frequency, auction, delivery, seasonal. Which means you spend the production budget on the actual problem instead of the phantom one.
Without pre-launch signal, every performance drop defaults to ‘maybe the creative was never great.’ With pre-launch signal, the creative is a known quantity going in. That does not extend the creative's lifespan. It changes what your team does when the creative eventually dies. Ship-more-creative becomes a diagnostic response, not a reflexive one.
This is honest positioning. Pre-launch testing is not a fatigue prevention system. It is diagnostic infrastructure that lets your team distinguish causes 2, 3, and 4 from cause 1 more reliably. That distinction is where the wrong response gets replaced with the right one, and where the production budget stops funding the wrong workstream.
The word matters
Every industry has terms of art that get overused into uselessness. In Meta media buying, ‘creative fatigue’ is the biggest one. It has a specific meaning (Meta's 45% drop after the 4th exposure, per their own 2023 research) and a very specific fix (a new creative variant). It has drifted into a catch-all for every performance drop the buyer cannot immediately explain.
The drift is expensive because the wrong-cause response makes the situation worse. If your problem is auction competition and you ship more creative, you have new ads competing for impressions in the same expensive auction. Costs stay high, the new creative eventually fatigues too, and you conclude Meta ads ‘do not work anymore.’
The next time your Meta account bleeds, the diagnostic move is not to schedule a production sprint. It is to walk through the four causes and figure out which one you are actually looking at. Cause 1 gets the creative fix. Causes 2, 3, and 4 get different fixes entirely.
The creative did not fatigue. Sometimes it did. Usually it did not. Now you know how to tell.
Fair questions
What is the actual frequency threshold that triggers real creative fatigue?
Meta's own 2023 analysis of about 26,000 test cases found conversion likelihood drops roughly 45% by the fourth exposure to the same creative, fitting a decay curve of (N+1)^-0.43. Meta's effective-frequency research pins the optimal band at 1-2 impressions per user per week, with a tipping point around 3.4 exposures where performance measurably degrades. So real fatigue kicks in when your average user has seen the same creative 3-4 times in a rolling week. If your account frequency is 2.1 and CTR just fell, it is almost never actually fatigue.
How can I tell if a performance drop is fatigue or the auction?
Check your average frequency first (Ads Manager → Delivery breakdown). If frequency is under 3, real fatigue is unlikely. Then check your CPM trend against your industry's aggregate. Tinuiti's Q4 2025 report showed Meta's Facebook CPM fell 13% aggregate — but 44% of individual advertisers saw prices RISE. If your CPM went up while the industry aggregate went up more, you are not being punished specifically. If your CPM went up while the industry aggregate went down, someone specific started competing with you (Novadata documented Temu and Shein swinging category CPMs 30-50% week over week). If your CPM rose in November or December, that is Q4 seasonality: Gupta Media's tracker puts Cyber Monday CPMs 138% above annual average. None of these are fixed by shipping more creative.
Did Meta's Andromeda update really cause performance drops in March 2026?
Yes, and it caused a mass misdiagnosis event. Meta deployed a rewrite of its delivery-retrieval mechanics in the first week of March 2026 without an announcement. Advertisers reported CPMs +15-40% and ROAS -23% in the first two weeks per Digital Applied and Common Thread Collective's post-mortems. Because there was no public rollout notice, thousands of media buyers looked at bleeding accounts and concluded 'the creative fatigued.' Emergency production sprints followed. Two months later most of those buyers had ROAS back, but not because they made better creative. They rebuilt around Andromeda's new mechanics. Those two months of production budget were spent on the wrong problem.
When should I kill a Meta ad?
Not on data less than 48-72 hours old. Attribution lag alone is 24-72 hours per AdManage's framework, so a 'zero conversions today' ad might have three conversions that just have not been attributed yet. Also not on Meta-only ROAS numbers alone — Meta has been under-reporting real conversions by 20-30% since iOS 14.5 per AdsAgent's 2026 analysis, so a ROAS-based pause rule using Meta-only figures routinely kills profitable ads. Common Thread found that during Cyber Five 2025, 2% of ads drove 56% of revenue. Given that concentration, premature kills are asymmetric — you are much more likely killing one of the 2% than one of the 98%. Check frequency, check the auction, check seasonality, check whether Meta shipped an algorithm change, before you conclude the creative is the problem.
Does pre-launch testing fix creative fatigue?
No. Pre-launch testing cannot prevent frequency saturation, competitor bid pressure, algorithm updates, or Q4 CPM spikes. Splitroom does not extend a creative's lifespan. What pre-launch testing does is change how you diagnose its death. If a specific static concept was pre-vetted as high-signal by a synthetic panel and it drops after two weeks, you can rule out 'the creative was bad' as the primary cause and go looking for the real one (auction, delivery drift, seasonal). Without pre-launch signal, every performance drop looks like creative fatigue by default because there is no baseline signal to rule the creative out. Pre-launch testing is diagnostic infrastructure, not a fatigue prevention system. Honest positioning matters more than a stronger product claim.
How much of a typical 'creative fatigue' verdict is actually creative fatigue?
There is no peer-reviewed answer to this. From the composite evidence: (a) Meta's own data pins real frequency-saturation fatigue as measurable only after the 3rd-4th exposure per user, so accounts running at average frequency under 3 are very unlikely to be fatiguing in the strict sense; (b) 44% of Meta advertisers saw CPM rises in Q4 2025 while the aggregate CPM fell 13% — that 44% was not fatiguing, they were being outbid; (c) the March 2026 Andromeda rollout produced a specific month with near-100% attribution error on the label; (d) Q4 CPM spikes of 138% over annual average happen every year, and every year some fraction of the resulting drops get attributed to the creative. Conservative composite estimate: on any given performance-drop day, real creative fatigue accounts for a minority of the cases where the label is used. The other three causes are what is usually happening.
Sources
- Creative Fatigue: How advertisers can improve performance by managing repeated exposures · Analytics at Meta (~26,000 test cases, Meta Marketing Science team) · retrieved 2026-08-15
- Tinuiti Q4 2025 Digital Ads Benchmark Report (aggregate FB CPM −13% YoY; 44% of advertisers saw prices rise) · Tinuiti (via Karooya summary) · retrieved 2026-08-15
- Meta Q4 2025 earnings: price per ad up 6% YoY, full-year up 9% · Marketing Brew (Jan 29, 2026) · retrieved 2026-08-15
- Temu and Shein's Stop-Start Ad Spend Is Whipsawing Facebook and Google Auctions (CPMs swing 30–50% week over week) · Novadata · retrieved 2026-08-15
- The true cost of social media ads in 2025 (Cyber Monday CPM 138% above 2024 annual average) · Gupta Media Meta CPM Tracker · retrieved 2026-08-15
- Why Meta Ads Performance Dropped in March 2026 (Andromeda algorithm rollout, unannounced) · Digital Applied · retrieved 2026-08-15
- Meta Andromeda Killed Your ROAS. Here's the Only Way to Get It Back. (Cyber Five 2025: 2% of ads drove 56% of revenue) · Common Thread Collective (3,014 advertiser dataset, 170+ brands via Statlas) · retrieved 2026-08-15
- Ad Fatigue in a Digital Analyst's Perspective: Audiences Are NOT the Ones Exhausted · Adobe Experience League Community · retrieved 2026-08-15
- Meta CAPI and iOS in 2026 (Meta under-reporting real conversions 20-30% since iOS 14.5) · AdsAgent · retrieved 2026-08-15
- When to Kill a Facebook Ad (48-72 hour minimum before pause; top 10% of ads = 50-70% of conversions) · AdManage.ai · retrieved 2026-08-15
Your ad creatives go in, up to six at once. A thousand synthetic consumers argue it out, before a dollar of media moves.
Free in early access · No card required