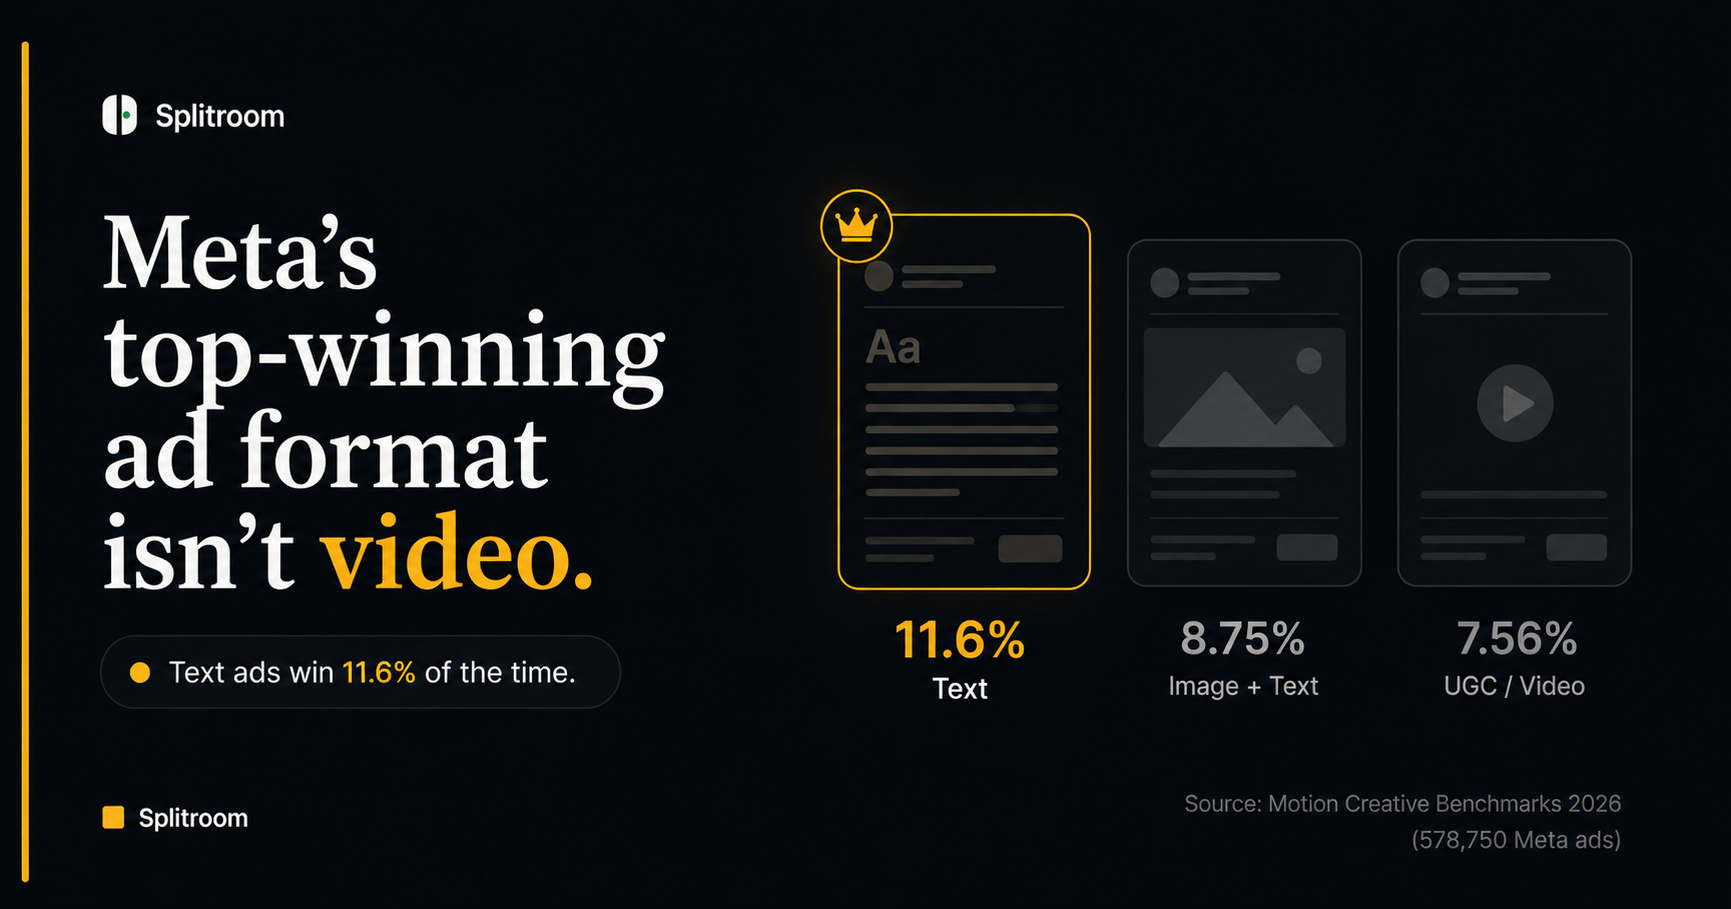
Meta's top-winning ad format isn't video. It's text.
Motion analyzed 578,750 Meta ads. Static formats won more often than video. Every AI creative tool is being built for the wrong half of Meta.
I have been reading Motion's 2026 Creative Benchmarks report for a week. Five hundred and seventy-eight thousand seven hundred and fifty Meta ads. One point two nine billion dollars in ad spend. Sorted twenty-one different ways.
The chart that stopped me was the hit-rate leaderboard by format.
The single highest-winning format on Meta right now is not a Reel. It is not a UGC hook. It is not Advantage+ video generation.
It is a text-only ad. Words on a solid background color. Winning 11.60% of the time, more than double the platform average.[1]
Meanwhile every AI creative tool funded in the last eighteen months is racing to generate video. That is the disconnect worth writing about.
Static ads win more often than video ads on Meta. Fifty-two percent of the active Meta ad pool is single-image, and roughly seventy-five percent is static-first (image, carousel, or text on background).[4] On Motion's benchmark of 578,750 ads and $1.29B in spend, the three formats with the highest hit rates (text-only, product-image with text, and lifestyle-product image) are all image-first.[1] Video is climbing on the new-creative flow but has not yet crossed fifty percent of the active pool. If your creative testing budget only covers video, you are only testing half of what actually wins on Meta.
The mix nobody talks about
There are three independent creative archives that measured this in the last six months. They agree on the direction, and they roughly agree on the number.
Adkumo pulled 10,000+ ads out of the Meta Ads Library in Q1 2026. Their breakdown: single image 52%, carousel 23%, video 19%, everything else 6%.[4] Three quarters of the live pool is what a design intern could make in an afternoon.
Segwise, publishing Curtis Howland's analysis from Misfit Marketing, ran a wider cut: 67,000 ads across 100+ top-performing DTC accounts. Median split across the panel: 61% static, 39% video.[5] The distribution ran from 1% video (SHEIN) and sub-10% (Calvin Klein) at one end, to 97% video (Shapellx) at the other. Static is not a small residual. It is the base state that a lot of the highest-performing DTC brands never leave.
AdSpyder, with a 55M+ Meta ad archive, published the year-over-year trajectory on the flow of newly-launched creatives. Video is climbing, but slowly. Image has been the majority every year until 2026.
| Year | Video | Image | New ads sampled |
|---|---|---|---|
| 2024 | 38.6% | 61.4% | 752K |
| 2025 | 47.2% | 52.8% | 8.4M |
| 2026 YTD | 50.8% | 49.2% | 1.6M |
2026 is the first year video crossed image on the flow. It has still not crossed image on the active pool.
Which raises the actual money question. Is the flow winning?
The hit-rate leaderboard that flips the script
Motion's Creative Benchmarks 2026 is the largest publicly-analyzed Meta ad dataset available: 578,750 creatives across 6,015 accounts, $1.29 billion in ad spend, September 2025 through early January 2026.[2] Motion defines a ‘winner’ as an ad that spends at least ten times the account's median ad spend and reaches $500 in total delivery. The platform-wide winner rate is roughly 5%.[8]
Here is what happens when you break that 5% average down by creative format.
| Format | Hit rate | Ranking |
|---|---|---|
| Text-only (words on background) | 11.60% | #1 |
| Product image with text | 8.75% | #2 |
| Lifestyle-product image | 7.59% | #3 |
| UGC (video / hybrid) | 7.56% | #4 |
| Review-style ads | 4.89% | #5 |
| Animation | 4.57% | #6 |
| Carousel | 4.45% | #7 |
The top three winning formats are all image-first. All three beat the platform average. Text-only beats it by 132%. Product-image with text by 75%. Lifestyle-product image by 52%.
Meanwhile the video and hybrid formats (UGC, review, animation) sit at or below the platform average. Carousel, technically static, sits at the bottom of Motion's leaderboard on hit rate (though carousels have their own aggregate-scale advantages Motion also documents).
The top-performing ad formats were the ones that were the easiest to make.Motion Creative Benchmarks 2026, hit-rate analysis
That is Motion's own summary of the finding. Read it slowly. The chart-topping Meta ad in 2026 is not a $30,000 UGC production. It is not a Reels edit with three creators. It is a JPG of a product photo with a headline on it. The kind of asset a media buyer can prototype ten variants of in an afternoon.
Why static keeps winning
Three reasons, all economic.
Cost per acquisition. ATTN Agency benchmarks (published via Segwise) put average static CPA around $34.50 and video CPA around $48.20 across their DTC panel. Video wins on CTR (1.9% vs 1.1%) and engagement (5.2% vs 1.4%). Viewers pay more attention to it. Static wins on conversion, meaning the attention video buys is not the attention that closes the sale.[5]
Iteration velocity. Motion's dataset also shows how many creatives per week the best accounts ship. Enterprise-tier advertisers ($1M+ monthly spend) launch an average of 18.85 new creatives per week; the top quartile ships 54.64.[2]That volume is not viable on video production timelines. It is viable on static production timelines. Every additional creative variant is another lottery ticket at Meta's 5% winner rate. Whichever format lets you ship more variants is the format that wins in aggregate.
Placement economics. Tinuiti's Q4 2025 report showed Meta CPM down 7% year-over-year, and Facebook CPM specifically down 13%, driven by cheaper Reels inventory. Which sounds like a video story. But Facebook Feed impression share fell to 27%, an all-time low.[6]Feed is the placement where static concentration is highest. Static's remaining Feed inventory got scarcer and probably better-performing per impression at the same time video inventory got cheaper on the surfaces optimized for scroll. Net effect for static: less of it running, against inventory designed to reward it.
Why the tooling chases video anyway
The gap between what wins on Meta and what the tooling market builds for is not accidental. It has three causes.
Meta's own PR gravity. Every Meta earnings call since 2023 has led with Reels. Q4 2025's press release opens with a Reels annual revenue run-rate over $50B and Advantage+ Creative video-generation adoption at $10B run-rate.[7]That is the message investors and product roadmaps pattern-match against. If you are building an ad-testing platform and your investors watch Meta's earnings, ‘focus on video’ is the safe answer to explain the roadmap.
VC economics.‘AI generates video creative’ is a bigger investment thesis than ‘AI tests static creative before launch.’ Video generation has a natural cost-per-unit story (replacing a $10K UGC shoot with a $200 render), which fits neatly into a VC forecast. Testing static creative before launch has a subtler story: raising the hit rate on 18 weekly ships from 5% to 8% is real money, but it requires the buyer to already believe hit-rate math matters.
Agency invoicing. Video production is billable. Static is Canva. Agencies are structurally incentivized to sell what they can bill, not what will win. That does not make them wrong; it makes them a specific kind of biased sample. When the entire agency ecosystem talks up video, remember the ecosystem does not include the accounts that skipped agencies and are shipping 18 static variants a week.
The result: every pre-launch creative-testing platform this cycle has skewed toward video. Marpipe, Poll the People, various syntheticusers.com adjacencies. All pointing product roadmaps at the video half of Meta. The half that wins more often per Motion's own data has, so far, been left alone.
The number Meta will not tell you
Read this piece back through and count the sources by publisher. Not one of them is Meta.
Meta has never published an aggregate image-vs-video creative share for its ad platform. Their earnings calls disclose Reels revenue run rates and Advantage+ Creative adoption metrics. Not the underlying mix of ads that actually run on Facebook and Instagram. Every number in this post came from a third-party archive (Motion, AdSpyder, Adkumo, Segwise) sampling the public Meta Ads Library.
That absence is a signal. Meta profits from a video-first investor narrative. Publishing that static ads still make up half of new creatives and three-quarters of the live pool would undermine that story. So they do not. Third-party archives measure it and publish it. Meta stays quiet.
Which is fine, but it should change how you interpret the tooling market. When every commercial tool is optimizing for what Meta says on stage, and Meta has an incentive to say video, you get a tooling market that under-serves the half of Meta advertisers whose actual creative mix is still static.
What this means if you are running Meta ads today
Four practical calls that fall directly out of the data above.
Do not over-index on video for verticals where static still owns the auction. Segwise's per-vertical recommendations, drawn from their 67K-ad panel: DTC 60/40 video/static, SaaS 70/30 static/video, Finance 60%+ static, Fashion 60-70% video cold and 70%+ static in retargeting, Beauty 80%+ video.[5]The default advice (‘go all in on Reels’) is right for beauty and healthcare. It is expensive advice for finance and SaaS.
Test your static creative pre-launch.Motion's data implies the biggest lever a media buyer has is raising the hit rate on shipped ads, and static ads have both a higher baseline hit rate and a shorter iteration cycle. A tool that filters your ten static concepts down to the two worth Meta-testing is doing more per dollar than a tool that generates ten more video concepts to ship untested.
Match your creative production budget to the mix. If you are spending 80% of your production dollars on video, and 20% of your winning ads are video (per your own account-level Motion breakdown), you are funding the wrong half.
Do not read Meta's earnings as market signal. Meta will keep talking about Reels because Reels revenue is a differentiated growth story for shareholders. The mix of creative that wins in the auction is not the same conversation.
What Splitroom actually does
Splitroomtests static Meta creatives before launch. Images, text-on-background ads, carousel decks, product-image variants. All four of the top winning formats on Motion's 2026 leaderboard run through the same pipeline. Two static ads go in. Up to a thousand synthetic buyers argue them out. Verdict, segment splits, and dimension attribution in about nine minutes.
Static is not our fallback. It is the market we picked deliberately. There are twenty companies competing to test video ads. Right now there is one purpose-built pre-launch judging tool for the format that occupies 52% of the live Meta ad pool and takes the top three hit-rate slots on Motion's benchmark. That is the specific, defensible position Splitroom exists to hold.
We do not process video. We probably will not process video. The winning half of Meta is not video; the loud half is. We are building for what wins.
The half that never gets tested
Every hour, media buyers around the world ship static Meta creatives that will lose money. Not because static loses on Meta. It does not. Because 95% of any given account's ads fail to reach winner threshold, and the buyer has no way to pre-filter which of their static concepts are among the 5% that will win.[2]
The video tooling market has built for the wrong half of that problem. The static half is where the volume is, where the winning rate is highest, and where the pre-launch judging tool did not exist until we built it.
The chart Motion published is a hit-rate leaderboard. In 2026, the top three positions on that leaderboard belong to formats you can make in Canva. That is the market.
Meta rewards static. Now the tools do too.
Fair questions
Does Splitroom test video ads?
No. Splitroom is built for static creative testing: images, text ads, carousel decks, product-image variants. That is a deliberate choice. Meta's own data shows the top-winning ad formats on the platform are all static: text-only ads win 11.60% of the time, product-image with text 8.75%, lifestyle-product image 7.59%, all well above the platform's 5% winner rate. Static ads make up 52% of the active Meta ad pool per Adkumo's Q1 2026 study, and 61% median across 67,000 top-performing DTC ads per Segwise. Building a video-testing tool means competing with every AI-video-generation platform in the market for a shrinking half of Meta traffic. Building a purpose-built static-testing tool means being the only serious player in the winning half. We picked the winning half.
What percentage of Meta ads are still static vs video in 2026?
It depends on whether you count new-creative launches or the currently active pool. On new launches, AdSpyder's 55M-ad archive shows the split moved from 61% image / 39% video in 2024 to 53% image / 47% video in 2025 to 49% image / 51% video in 2026 year-to-date. On the active pool, Adkumo's Q1 2026 study of 10,000+ ads found 52% single image, 23% carousel, 19% video. Segwise's median across 67,000 ads from 100+ top-performing DTC accounts was 61% static / 39% video. Video is climbing on the flow, but it has not yet crossed 50% of the actual live ad pool.
Why don't creative testing tools focus on static ads?
Two structural reasons. First, industry narrative. Meta itself talks up Reels revenue ($50B annual run rate as of Q3 2025) and Advantage+ video generation ($10B run rate) on every earnings call. That gravity pulls product roadmaps toward video. Second, VC economics. 'AI generates video' is a bigger investment thesis than 'AI tests static creative.' Every creative-testing platform funded in the last 18 months has skewed toward video generation and testing. The result: the winning half of Meta's ad ecosystem (text, product images, lifestyle images) has no purpose-built pre-launch judging tool. Splitroom is the one purpose-built for it.
Does Meta publish an official image-vs-video mix for its ad platform?
No. Meta has never published an aggregate image-vs-video creative share for Facebook or Instagram. Their earnings calls disclose Reels revenue run rates and Advantage+ Creative adoption metrics, but not the underlying format mix of ads that actually run on the platform. Every number in this post came from third-party creative archives (Motion, AdSpyder, Adkumo, Segwise) sampling the public Meta Ads Library. That absence itself is telling: Meta profits from a video-first investor narrative, and publishing that static ads still make up 50-75% of the live pool would undermine that story.
Is static actually better than video for Meta ads?
Not universally. It is better on unit economics for most direct-response verticals. ATTN Agency benchmarks (published via Segwise) put static CPA at about $34.50 vs video CPA at about $48.20 across their DTC panel. Video wins on CTR (1.9% vs 1.1%) and engagement (5.2% vs 1.4%), but loses on cost per conversion. So the honest answer: for Meta advertisers whose success metric is CPA, static outperforms video in aggregate. For advertisers optimizing for reach, brand lift, or top-of-funnel awareness, video's higher engagement matters more. Which is why Segwise recommends different splits by vertical: DTC 60/40 video/static, SaaS 70/30 static/video, Beauty 80%+ video.
Which industries still use mostly static ads on Meta?
Per multiple third-party datasets, finance, SaaS, fashion (especially retargeting), consumer electronics, and B2B lead-gen still concentrate 60%+ of their Meta creative in static formats. Healthcare, beauty, entertainment, and gaming skew heavily video. Segwise's DTC panel recommendations: run 60-70% video for cold audiences, 70%+ static for retargeting. That ratio maps to how audience stage-of-buying maps to creative fatigue and CTR needs. If you are in a vertical where static still owns the majority of live ads, testing your static creative pre-launch is where the biggest ROI gains hide.
Sources
- Meta Ads in 2026: How Many Creatives Do You Actually Need to Launch? · Motion (Creative Benchmarks 2026) · retrieved 2026-08-04
- Creative Benchmarks 2026 (578,750 ads, 6,015 accounts, ~$1.29B Meta spend) · Motion · retrieved 2026-08-04
- What 365 Million Ads Tell Us About the Most-Used Ad Formats in 2026 · AdSpyder · retrieved 2026-08-04
- What We Learned Analyzing 10,000 Ads in Our Repository · Adkumo · retrieved 2026-08-04
- Static vs. Video Ratio for Meta Ads: Data From 67,000 Ads · Segwise (Curtis Howland / Misfit Marketing) · retrieved 2026-08-04
- Digital Ads Benchmark Report Q4 2025 · Tinuiti · retrieved 2026-08-04
- Meta Reports Fourth Quarter and Full Year 2025 Results · Meta Investor Relations · retrieved 2026-08-04
- Motion Creative Benchmarks 2026: 8 Key Takeaways · Foxwell Digital · retrieved 2026-08-04
- Meta Ads Benchmarks by Creative Format (2026) · AdAmigo.ai · retrieved 2026-08-04
Your ad creatives go in, up to six at once. A thousand synthetic consumers argue it out, before a dollar of media moves.
Free in early access · No card required