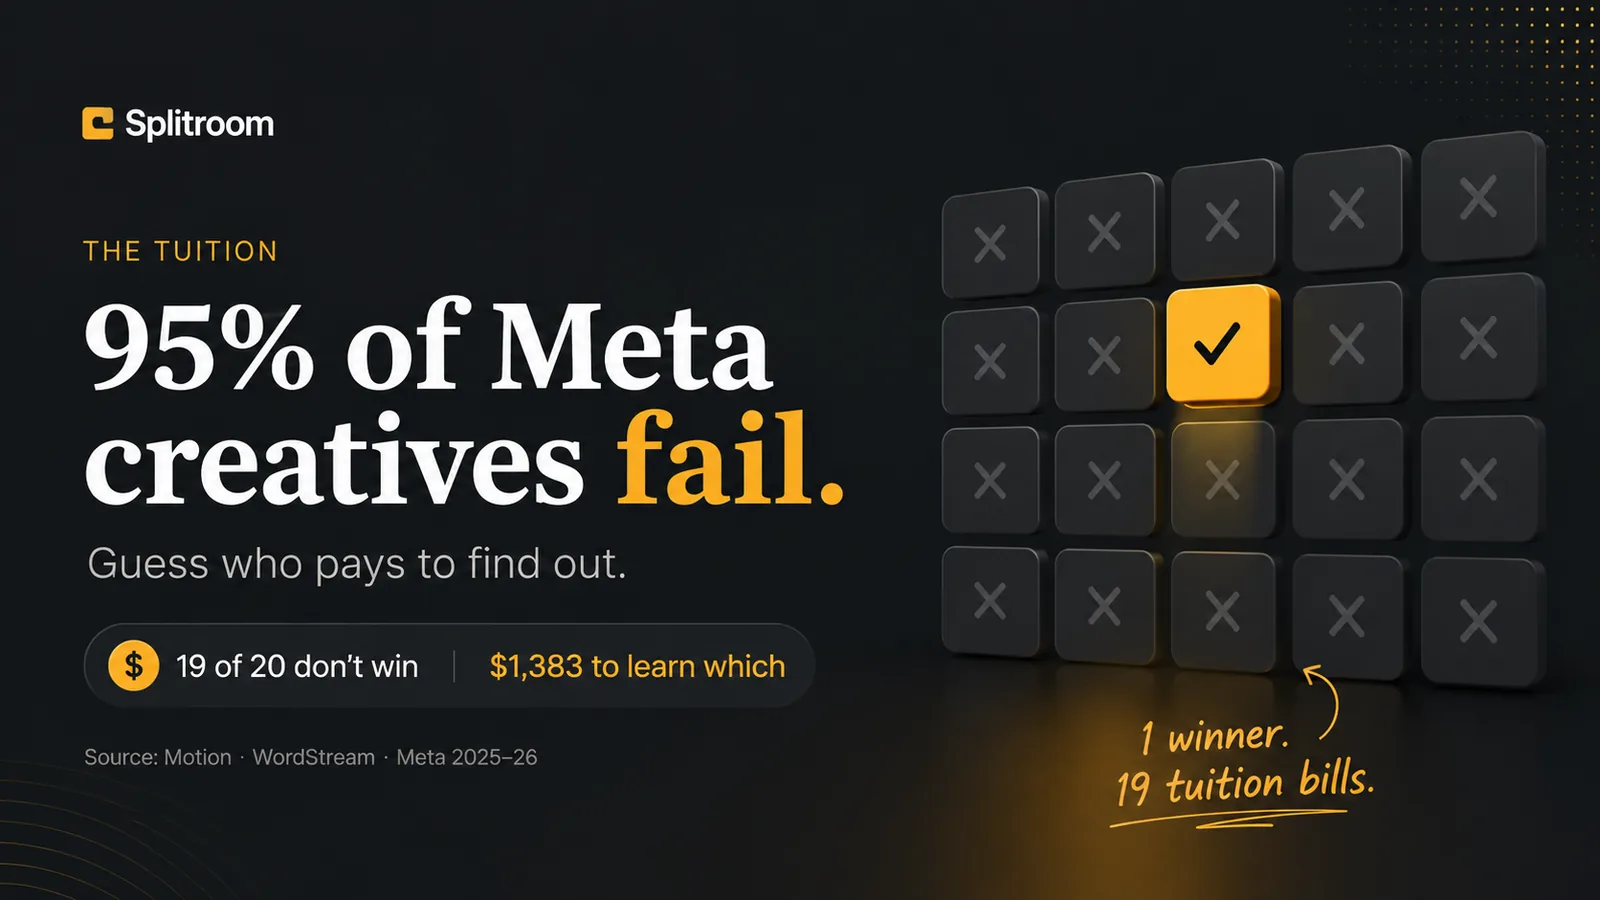
95% of Meta creatives fail. Guess who pays to find out.
$1,383 in the US. $80 in India. $1,216 globally. That's the tuition per creative to reach Meta's Learning Phase verdict, and 95% never clear it.
Day one. You ship two ads you believe in.
Day four. One is quietly winning. The other isn’t dead, isn’t obviously wrong. It’s just being fed a little less.
Day nine. Meta throws a Learning Limited banner on the loser, and by then you have already spent whatever you were going to spend on it.
That is the tuition. Not the CPM. Not the CPA. The money Meta charges you to find out which creative wasn’t going to win.
Nineteen out of twenty ads don’t win. That is the number I keep coming back to. Motion’s 2026 study of 578,750 Meta creatives puts the winner rate at roughly 5%.[1] The other 95% are what everyone means when they say creative testing is expensive. Below is the actual math on how expensive, sourced from Meta’s own earnings, WordStream’s 2025 benchmarks, and Motion’s dataset. It is not a comforting read.
How the money leaks
The mechanism is not exotic. When you launch a creative, Meta’s optimizer wants roughly 50 conversion events in the first week to exit what it calls the Learning Phase.[11] Below that, delivery is volatile and the algorithm is hedging. You are paying for its uncertainty.
Here is what that costs, on WordStream’s 2025 numbers. All-industries US cost per lead on Meta is $27.66, up nearly 21% year over year.[3] Multiply by fifty. About $1,383 to run one creative in one ad set until Meta will render a verdict. That is the price of finding out. If the creative is one of the 95% that don’t clear Motion’s winner threshold, the $1,383 is gone and Meta has already booked the revenue.
$27.66 is a lead-gen benchmark. Purchase economics are different, and for D2C verticals they are worse. WordStream 2025 puts cost per lead in Beauty & Personal Care at $51.42 and Health & Fitness at $52.98, roughly 2× the all-industries average.[3] If you are running a D2C brand in one of those verticals, the floor for one creative is closer to $2,500 to $2,700, not $1,383. Every number in the geo table below scales by the same multiplier.
Outside the US the same math produces a very different bill. Superads publishes CPM medians across roughly $3B in aggregated Meta spend for July 2025 through July 2026,[10] which lets us scale the US floor by geo. Local CTR and CVR move the true number up or down, so treat the non-US rows as first-order estimates.
| Geo | Median Meta CPM | Floor cost per creative (50 events) | Source |
|---|---|---|---|
| United States | $23.42 | $1,383 | WordStream 2025[3] · Superads US[4] |
| India | $1.35 | ~$80 | Superads India[5] |
| United Kingdom | $17.38 | ~$1,026 | Superads UK[6] |
| Australia | $14.38 | ~$849 | Superads AU[7] |
| Canada | $13.05 | ~$771 | Superads CA[8] |
| UAE | $15.80 | ~$933 | Superads UAE[9] |
| Global median | $20.59 | ~$1,216 | Superads Global[10] |
And that is the floor, not the average. Most teams buffer above 50 events for confidence, run several ad sets in parallel per creative, and rebuild the Learning Phase every time they materially edit anything. Doubling the floor for a real kill decision is common. Some agencies plan on three to five times.
The 5% number, and why it ruins every plan
Motion’s Creative Benchmarks 2026 is the largest published dataset on Meta creative performance. 578,750 creatives, 6,015 accounts, $1.29 billion in Meta ad spend, September 2025 through January 2026.[1] It is the closest thing to an independent audit of what happens after you click Publish.
Their definition of a winner is blunt. Ten times the account’s median ad spend, plus at least $500 in total delivery. Not “top-performing.” Not “shows promise.” The algorithm has decided to keep feeding this one.
About 5% of creatives clear that bar. Nineteen out of twenty do not. The bimodality is not incidental. Meta’s optimizer exists to identify a small handful of winners and starve everything else, and it does. Across the dataset, 55% of total ad spend concentrates on the winning 5%. At enterprise accounts, 64%.[1]
“~5% of creatives are winners (≥10× account median spend, ≥$500).”Motion Creative Benchmarks 2026 · 578,750 creatives, $1.29B in Meta spend
Losing creatives don’t merely underperform. They are what the account pays so the algorithm can find the winners. Which is fine, until you count what the finding actually costs.
Three costs your ad manager won’t show you
The media spend is only the visible layer. Three more compound on top of it, and none of them appear anywhere in the ad manager column headers.
Learning Phase resets are new tuition bills
Meta’s Learning Phase restarts every time an ad set undergoes what Meta calls a “significant edit,” including creative swaps, targeting changes, and material budget shifts.[11] So: you spend the $1,383 to reach 50 events, decide the creative is a loser, and swap in a fresh one. The ad set goes back to zero. The next 50 events cost the same amount again. Fast iteration sounds cheap on a whiteboard. In practice, every kill is a fresh tuition bill.
The auction is getting more expensive
Meta’s Q4 2025 earnings release documents an average price-per-ad increase of 9% year over year across all of 2025, and 6% in Q4 alone. Ad impressions delivered grew 12% for the year.[2] Meta is selling more ads and more expensive ads at the same time. The $1,383 US test does not buy in 2026 what it did in 2024. Compounded at 9% a year, the same floor costs about 19% more two years out.
The winner you didn’t fund
Because winners capture 55% of Meta spend across the Motion dataset, and 64% at enterprise scale,[1] every ad set running a loser is displacing budget that would otherwise have been feeding a winner. The true cost of a bad creative is not just the money it burned. It is the return of the winner your budget didn’t reach in time. That number never shows up anywhere Meta will let you see.
Why the biggest spenders just run more creatives
Look at what the largest Meta advertisers actually do, and the answer isn’t “make better ads.” It is “make more of them.”
Motion’s data shows enterprise-tier advertisers launching 18.8 creatives per week and reaching an 8.2% winner rate, versus 3.8% at micro accounts.[1][13] Enterprise creative isn’t inherently smarter than what a small brand ships. The advantage is arithmetic. At five creatives per week and a 5% hit rate, an account produces roughly one winner every four weeks. At twenty per week, one every week. Test more, surface more, feed more.
This is why creative volume has quietly become a structural input to media performance rather than a nice-to-have. It isn’t a philosophy. It’s a response to the winner rate.
Full-year 2025: average price per ad up 9% year over year. Ad impressions delivered up 12%. Ad revenue $196.18B of $200.97B total, or about 97% of the company. Meta Q4 2025 Investor Release, January 28 2026.[2]
What actually changes the math
If 5% of creatives are going to win, and each losing test costs somewhere between about $80 (India) and $1,400+ (US) just to reach the algorithm’s decision point, the operational question stops being can we make better ads. It becomes can we kill losers before we pay for the tuition.
Three responses show up in real practice.
- Test more, on purpose. The 18.8-creatives-per-week rhythm in the Motion data isn’t wasteful. It’s the volume game working as intended. At a 5% hit rate, more shots at goal is the only reliable path to more winners.
- Test off the auction first. Static concept tests, small-panel surveys, moderated focus groups, and synthetic panels (Splitroom is one of these; there are others) try to filter obvious losers before they touch Meta’s Learning Phase. None of them replace real delivery. Every one of them can replace a $1,383 tuition bill for a loser you would have caught anyway.
- Treat creative as a portfolio. Know your baseline hit rate. Cap the tuition per test. Kill fast. Most performance-marketing agencies have already converged on this. Motion’s benchmarks make the math visible, and Meta’s earnings make it clear the pressure isn’t relenting.
The 5% hit rate isn’t going down. The CPM isn’t going down. Meta’s price per ad is up 9% a year on Meta’s own reporting. Whatever an advertiser does about creative testing, the cost of ignoring it is now sourced and specific.
Fair questions
What percentage of Meta ad creatives are actually winners?
Roughly 5% of creatives qualify as winners on Meta, defined as spending at least 10 times the account's median ad spend and reaching at least $500 in total spend. That figure comes from Motion's Creative Benchmarks 2026, a dataset of 578,750 creatives and $1.29 billion in Meta ad spend from September 2025 through January 2026. Enterprise advertisers reach a slightly higher winner rate of 8.2%, largely because they test more creatives per week, not because their individual creatives are inherently better.
What does one Meta ad creative cost to test to a decision?
As a floor, it costs about $1,383 in the United States to run one lead-generation ad set to Meta's Learning Phase threshold (50 optimization events per week per ad set), using WordStream's 2025 all-industries US cost per lead of $27.66. In India the equivalent floor is roughly $80, and the global median works out to about $1,217. These are minimums. Real test budgets are higher once you account for buffer above the 50-event threshold, Learning Phase resets when you edit creatives, and the fact that most brands need multiple ad sets to reach a confident kill decision.
Are Meta ads getting more expensive?
Yes. Meta's Q4 2025 earnings release reports that the average price per ad rose 9% year over year across full-year 2025, while ad impressions delivered grew 12%. So Meta is selling both more ads and more expensive ads at the same time. The auction is getting tighter, and the cost of losing a creative is rising with it.
How much does a Meta CPM cost in India versus the United States in 2026?
Superads' aggregated dataset (roughly $3 billion in Meta ad spend across thousands of accounts) puts the median US CPM at $23.42 and the median India CPM at $1.35 for the July 2025 to July 2026 window. That is roughly a 17 to 1 gap. India's low CPM does not make losing creatives cheap on a percentage basis, but the absolute cost of a bad test in India is materially smaller. That is why India is often used as a first-pass creative-testing ground for global brands.
How many creatives does an average Meta advertiser need to run each week?
Motion's 2026 dataset shows enterprise-tier Meta advertisers launch an average of 18.8 creatives per week. At a 5% winner rate, that produces roughly one new winner every week. Smaller brands testing four or five creatives per week are effectively hoping to catch a winner every four to five weeks. That is why creative volume is now treated as a structural input to media performance, rather than a nice-to-have.
Sources
- Creative Benchmarks 2026 · Motion · retrieved 2026-07-14
- Meta Reports Fourth Quarter and Full Year 2025 Results · Meta Investor Relations, Jan 28 2026 · retrieved 2026-07-14
- Facebook Ads Benchmarks 2025 · WordStream, Sep 15 2025 · retrieved 2026-07-14
- Facebook Ads CPM, United States · Superads (aggregated ~$3B Meta ad spend, Jul 2025 to Jul 2026) · retrieved 2026-07-14
- Facebook Ads CPM, India · Superads · retrieved 2026-07-14
- Facebook Ads CPM, United Kingdom · Superads · retrieved 2026-07-14
- Facebook Ads CPM, Australia · Superads · retrieved 2026-07-14
- Facebook Ads CPM, Canada · Superads · retrieved 2026-07-14
- Facebook Ads CPM, United Arab Emirates · Superads · retrieved 2026-07-14
- Facebook Ads CPM, Global · Superads · retrieved 2026-07-14
- About the learning phase · Meta Business Help Center · retrieved 2026-07-14
- Facebook Ads Average Conversion Rate · Focus Digital, Sep 23 2025 · retrieved 2026-07-14
- Motion Creative Benchmarks 2026: 8 Key Takeaways · Foxwell Digital, Mar 16 2026 · retrieved 2026-07-14
Your ad creatives go in, up to six at once. A thousand synthetic consumers argue it out, before a dollar of media moves.
Free in early access · No card required